NZD/USD Price Analysis: Bears aim for five-week low of 0.6554
- NZD/USD extends losses below 200-bar SMA, 61.8% Fibonacci retracement.
- The previous week’s top will limit near-term recovery, December 11 low can please bears during further weakness.
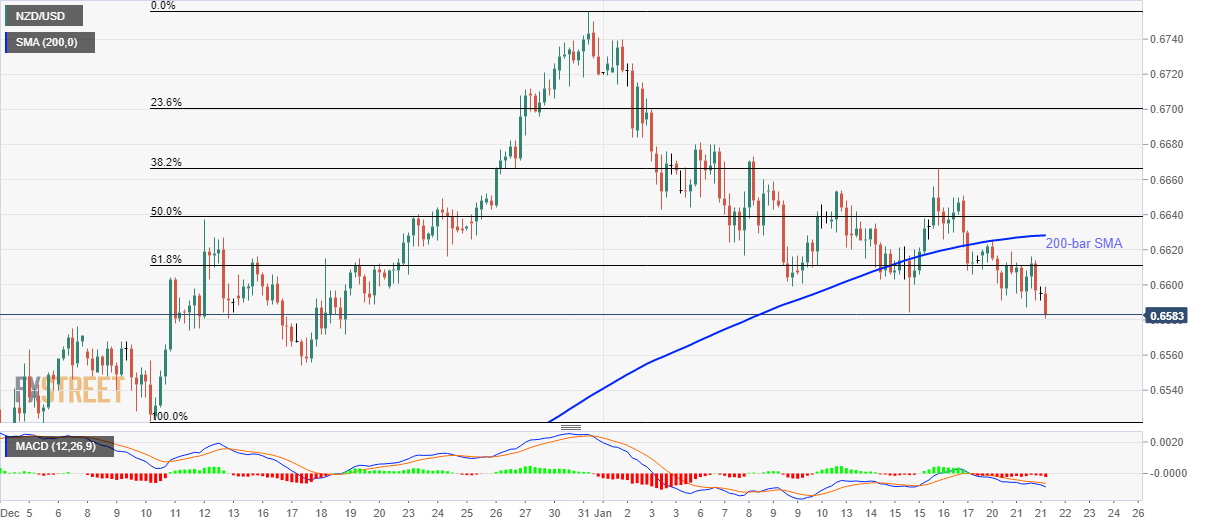
NZD/USD stretches losses to monthly of 0.6581 by the press time of early Wednesday. The pair remains on the back foot below 200-bar SMA and 61.8% Fibonacci retracement of its run-up from December 11 to 31. Also supporting the sellers are bearish MACD signals.
As a result, December 18 low near 0.6554 is likely arriving on the chart whereas December 11 bottom close to 0.6520 can mark its presence afterward.
If at all the NZD/USD prices fail to bounce off 0.6520, a 200-day SMA level near 0.6513 can offer another chance which if ignored can recall sub-0.6500 area back to the charts.
On the upside, 61.8% Fibonacci retracement around 0.6610 and 200-bar SMA level of 0.6630 can challenge the pair’s short-term pullbacks ahead of the previous week’s high close to 0.6670.
During the pair’s recovery beyond 0.6670, the 0.6682 and 0.6700 will gain the buyers’ attention.
NZD/USD four-hour chart

Trend: Bearish
