Back
28 Feb 2020
US Dollar Index Price Analysis: DXY crushes bulls’ hopes, trades in 3-week’s lows near 98.00 level
- DXY is melting down from the 2020 tops.
- The level to beat for bears is the 97.80 level.
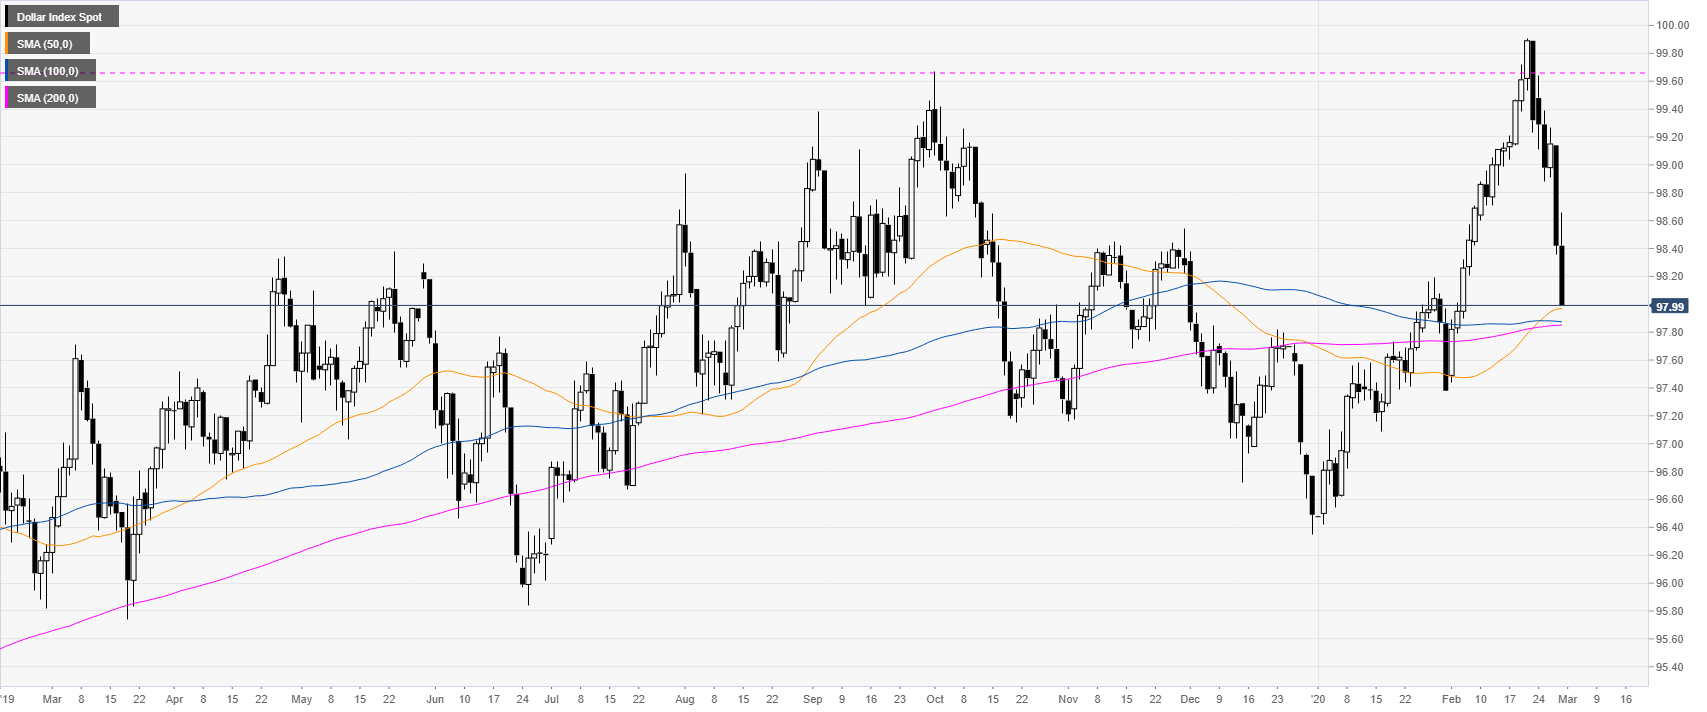
DXY daily chart
The US dollar index (DXY) is retracing back down below the 2019 high at 99.67 level. The risk-off mode in global markets and the all-time low in US bond-yields are weighing heavily on the US dollar.
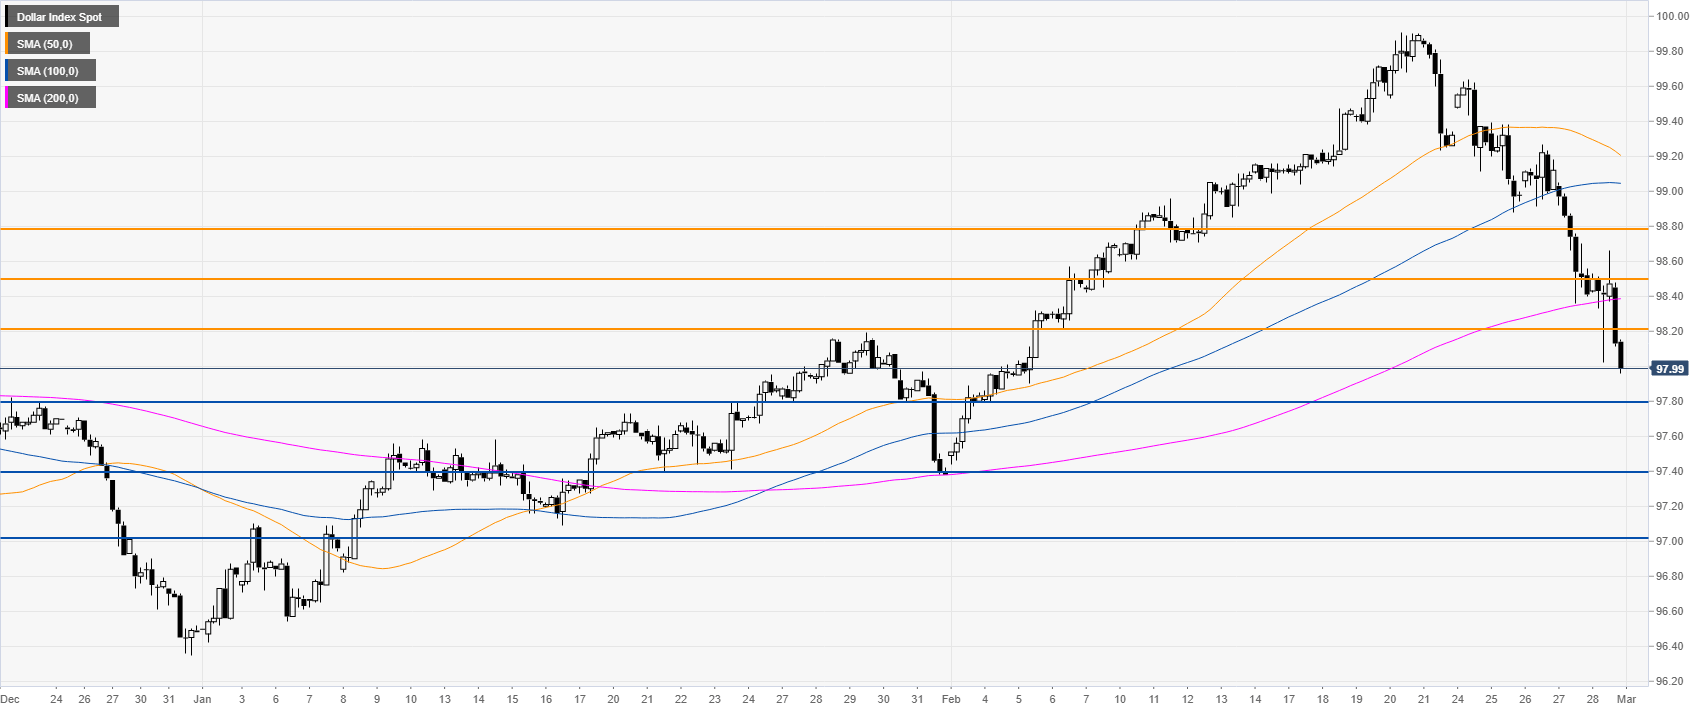
DXY four-hour chart
The greenback is trading near its lowest in three weeks while trading below its main SMAs on the four-hour chart. There is little hope for any respite in DXY selling as bears might be heading towards the 97.80 and 97.40 levels. The greenback is expected to meet resistance on any run to 98.20 or 98.50 levels.
Additional key levels